Transfers report
The transfers report shows the shipments sent from a location in a period: how many were checked before they left, how long transfers took to ship and to arrive, and the units the destination didn’t accept, broken down by the person who checked them, by destination and by product.
Where to find it
Go to Reports, then click Transfers. You need the View reports permission to see it.
Choose a period from the menu at the top of the report: today, yesterday, or the last 7, 30 or 90 days. Most figures show how they changed against the period of the same length before it. The report covers shipments sent from the location shown at the top right, which you can change from there. To see the stock arriving at a location, use the receiving report.
Which shipments it counts
The report counts every shipment that leaves the location, whether it was shipped in Scanpacker or in the Shopify admin. A shipment counts on the day it was marked as in transit, so a transfer sent in several shipments appears once for each of them. Draft shipments don’t count until they’re shipped, and a shipment that’s deleted in Shopify drops out of the report.
A shipment counts as checked when someone checked it or built the transfer by scanning before it shipped. Shipments sent with Ship without checking, and shipments sent from the Shopify admin, count as not checked.
Reading the report
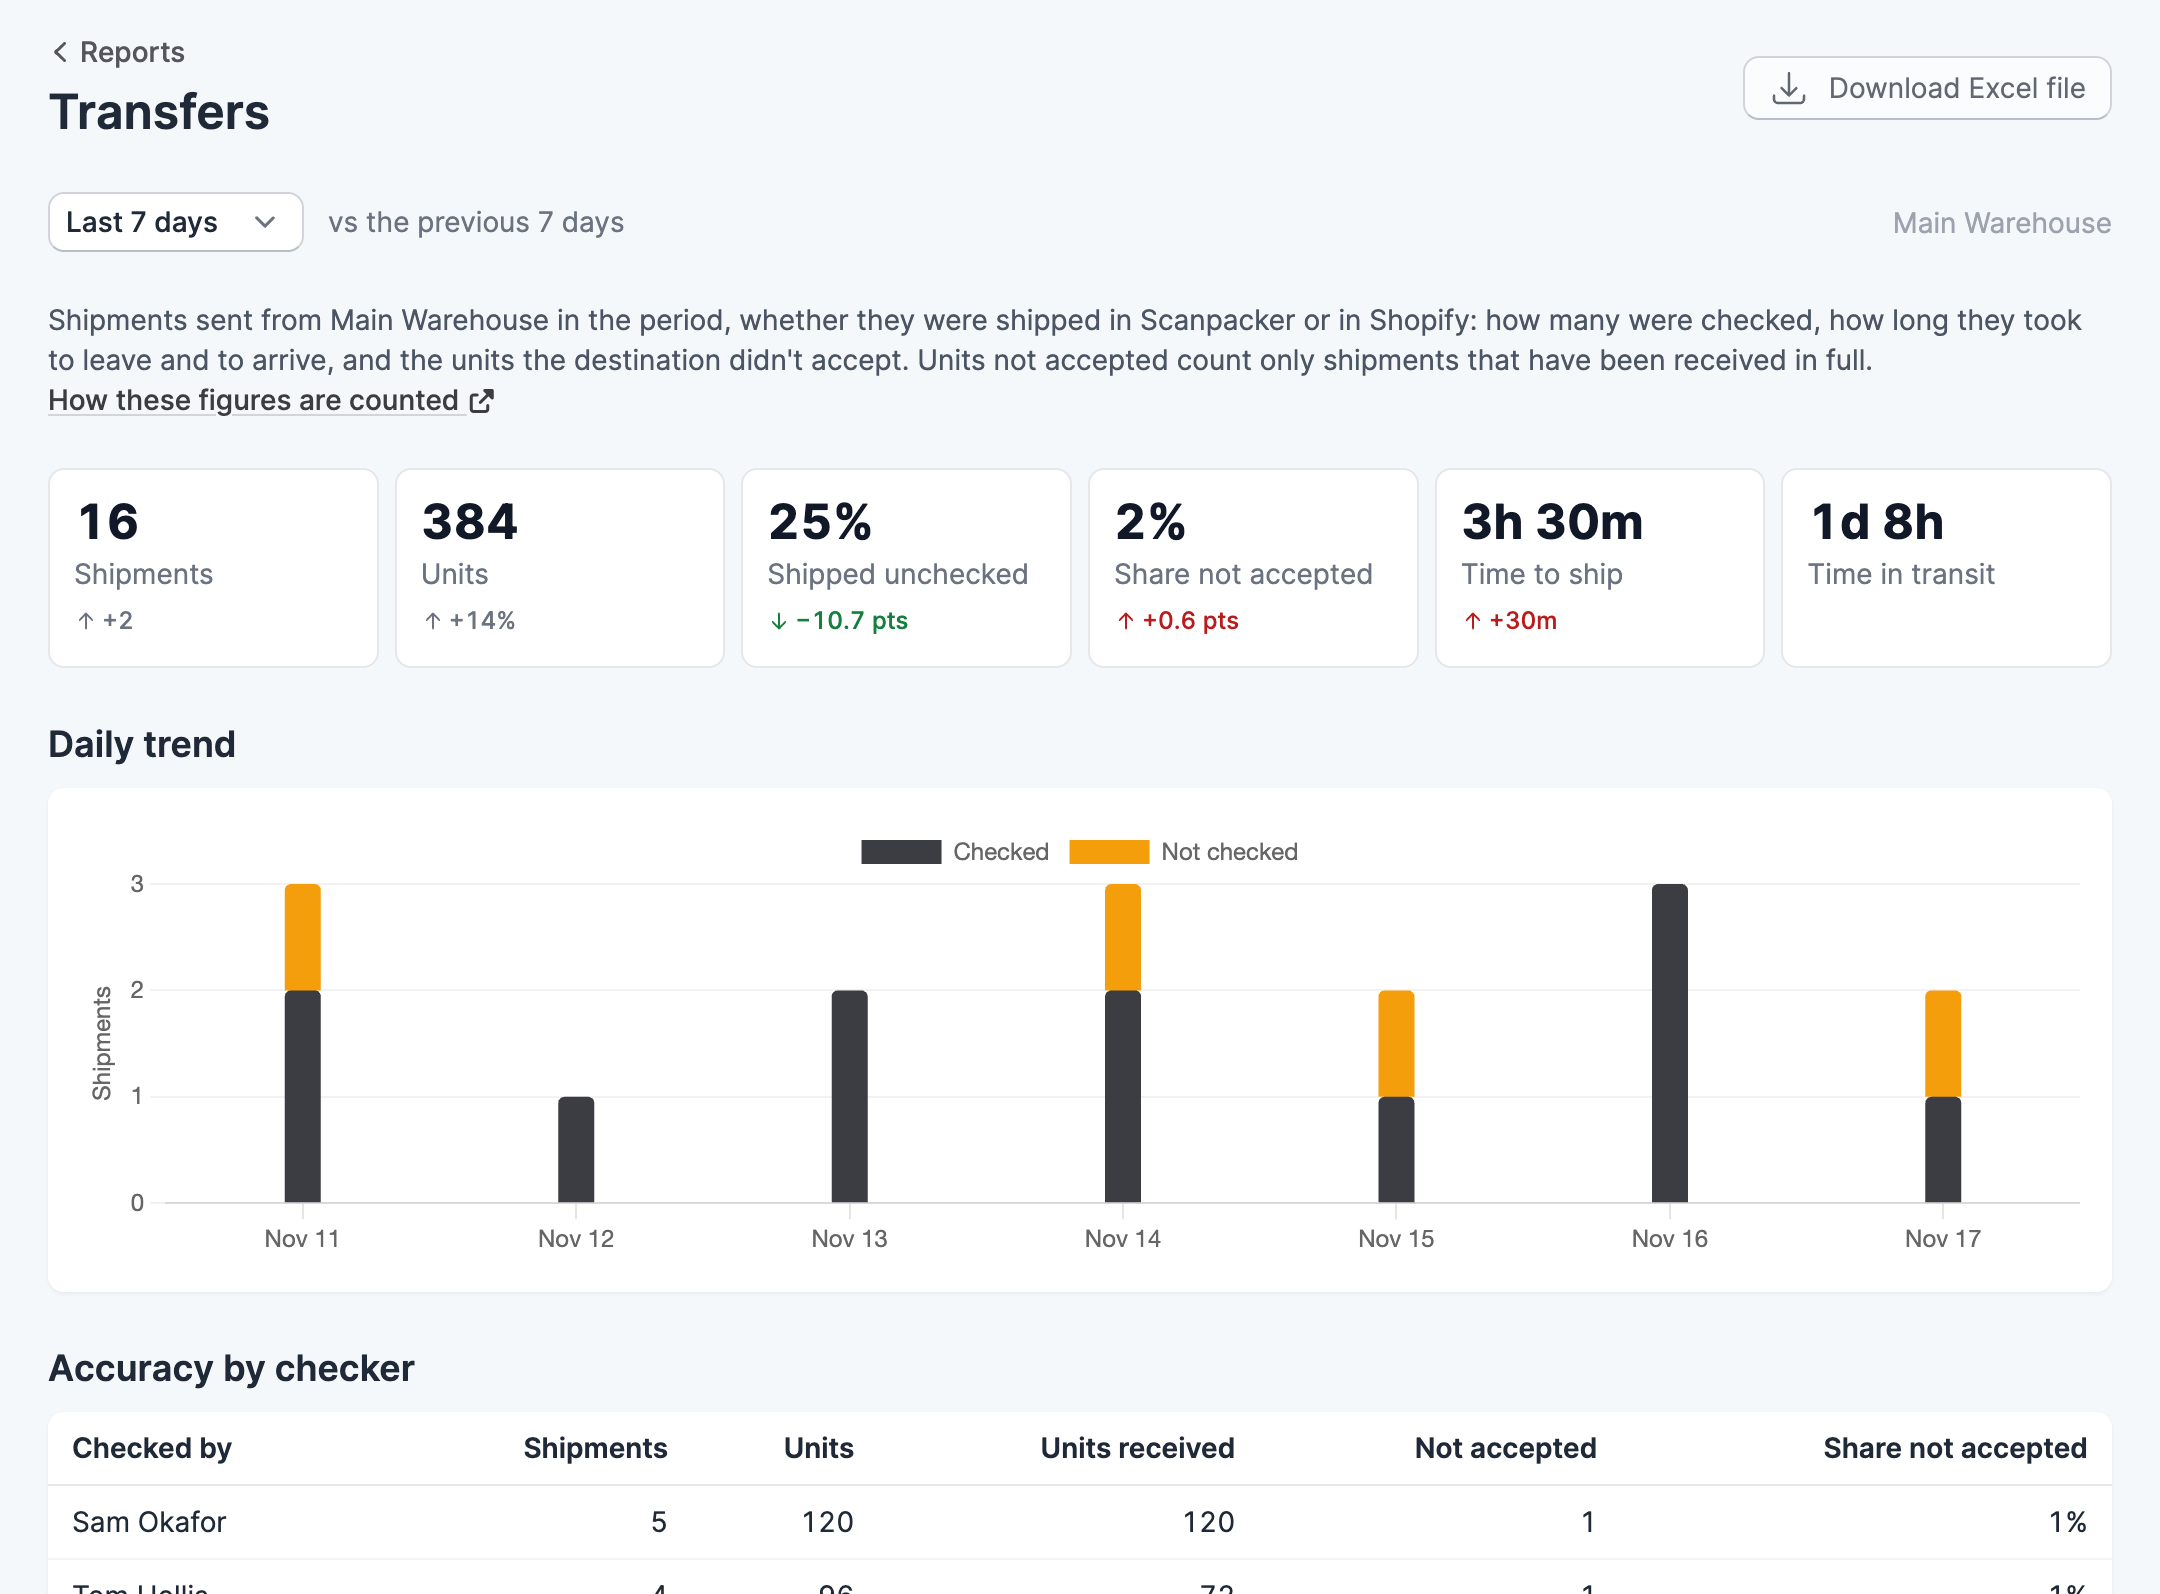
Shipped unchecked is the share of shipments that left without being checked. Time to ship is the typical time from a transfer being created to its shipment leaving, and Time in transit is the typical time from a shipment leaving to the destination receiving all of it. Both are medians, so one shipment that waited a week doesn’t distort them.
Share not accepted compares the units the destination rejected, or canceled as never arriving, with the units shipped. Scanpacker can only know what was accepted once a shipment has been received in full, so this figure, and every count of units not accepted, includes only those shipments. A shipment still on its way, or only partly received, counts towards the shipments and units sent but not towards the losses.
The trend chart shows the shipments sent each day or week, with the checked shipments and the unchecked ones stacked so that each bar adds up to the total.
Accuracy by checker sets each person’s checked shipments against what the destination accepted, with the unchecked shipments together on one row. A checker whose shipments lose more units than unchecked ones can point to a checking problem, while losses on unchecked shipments show what checking might have caught. By destination shows the losses and the typical time in transit for each destination, and Products not accepted lists the products the destinations rejected or canceled most.
Download the report
Click Download Excel file to save the figures as a spreadsheet, with the times in seconds.