Products
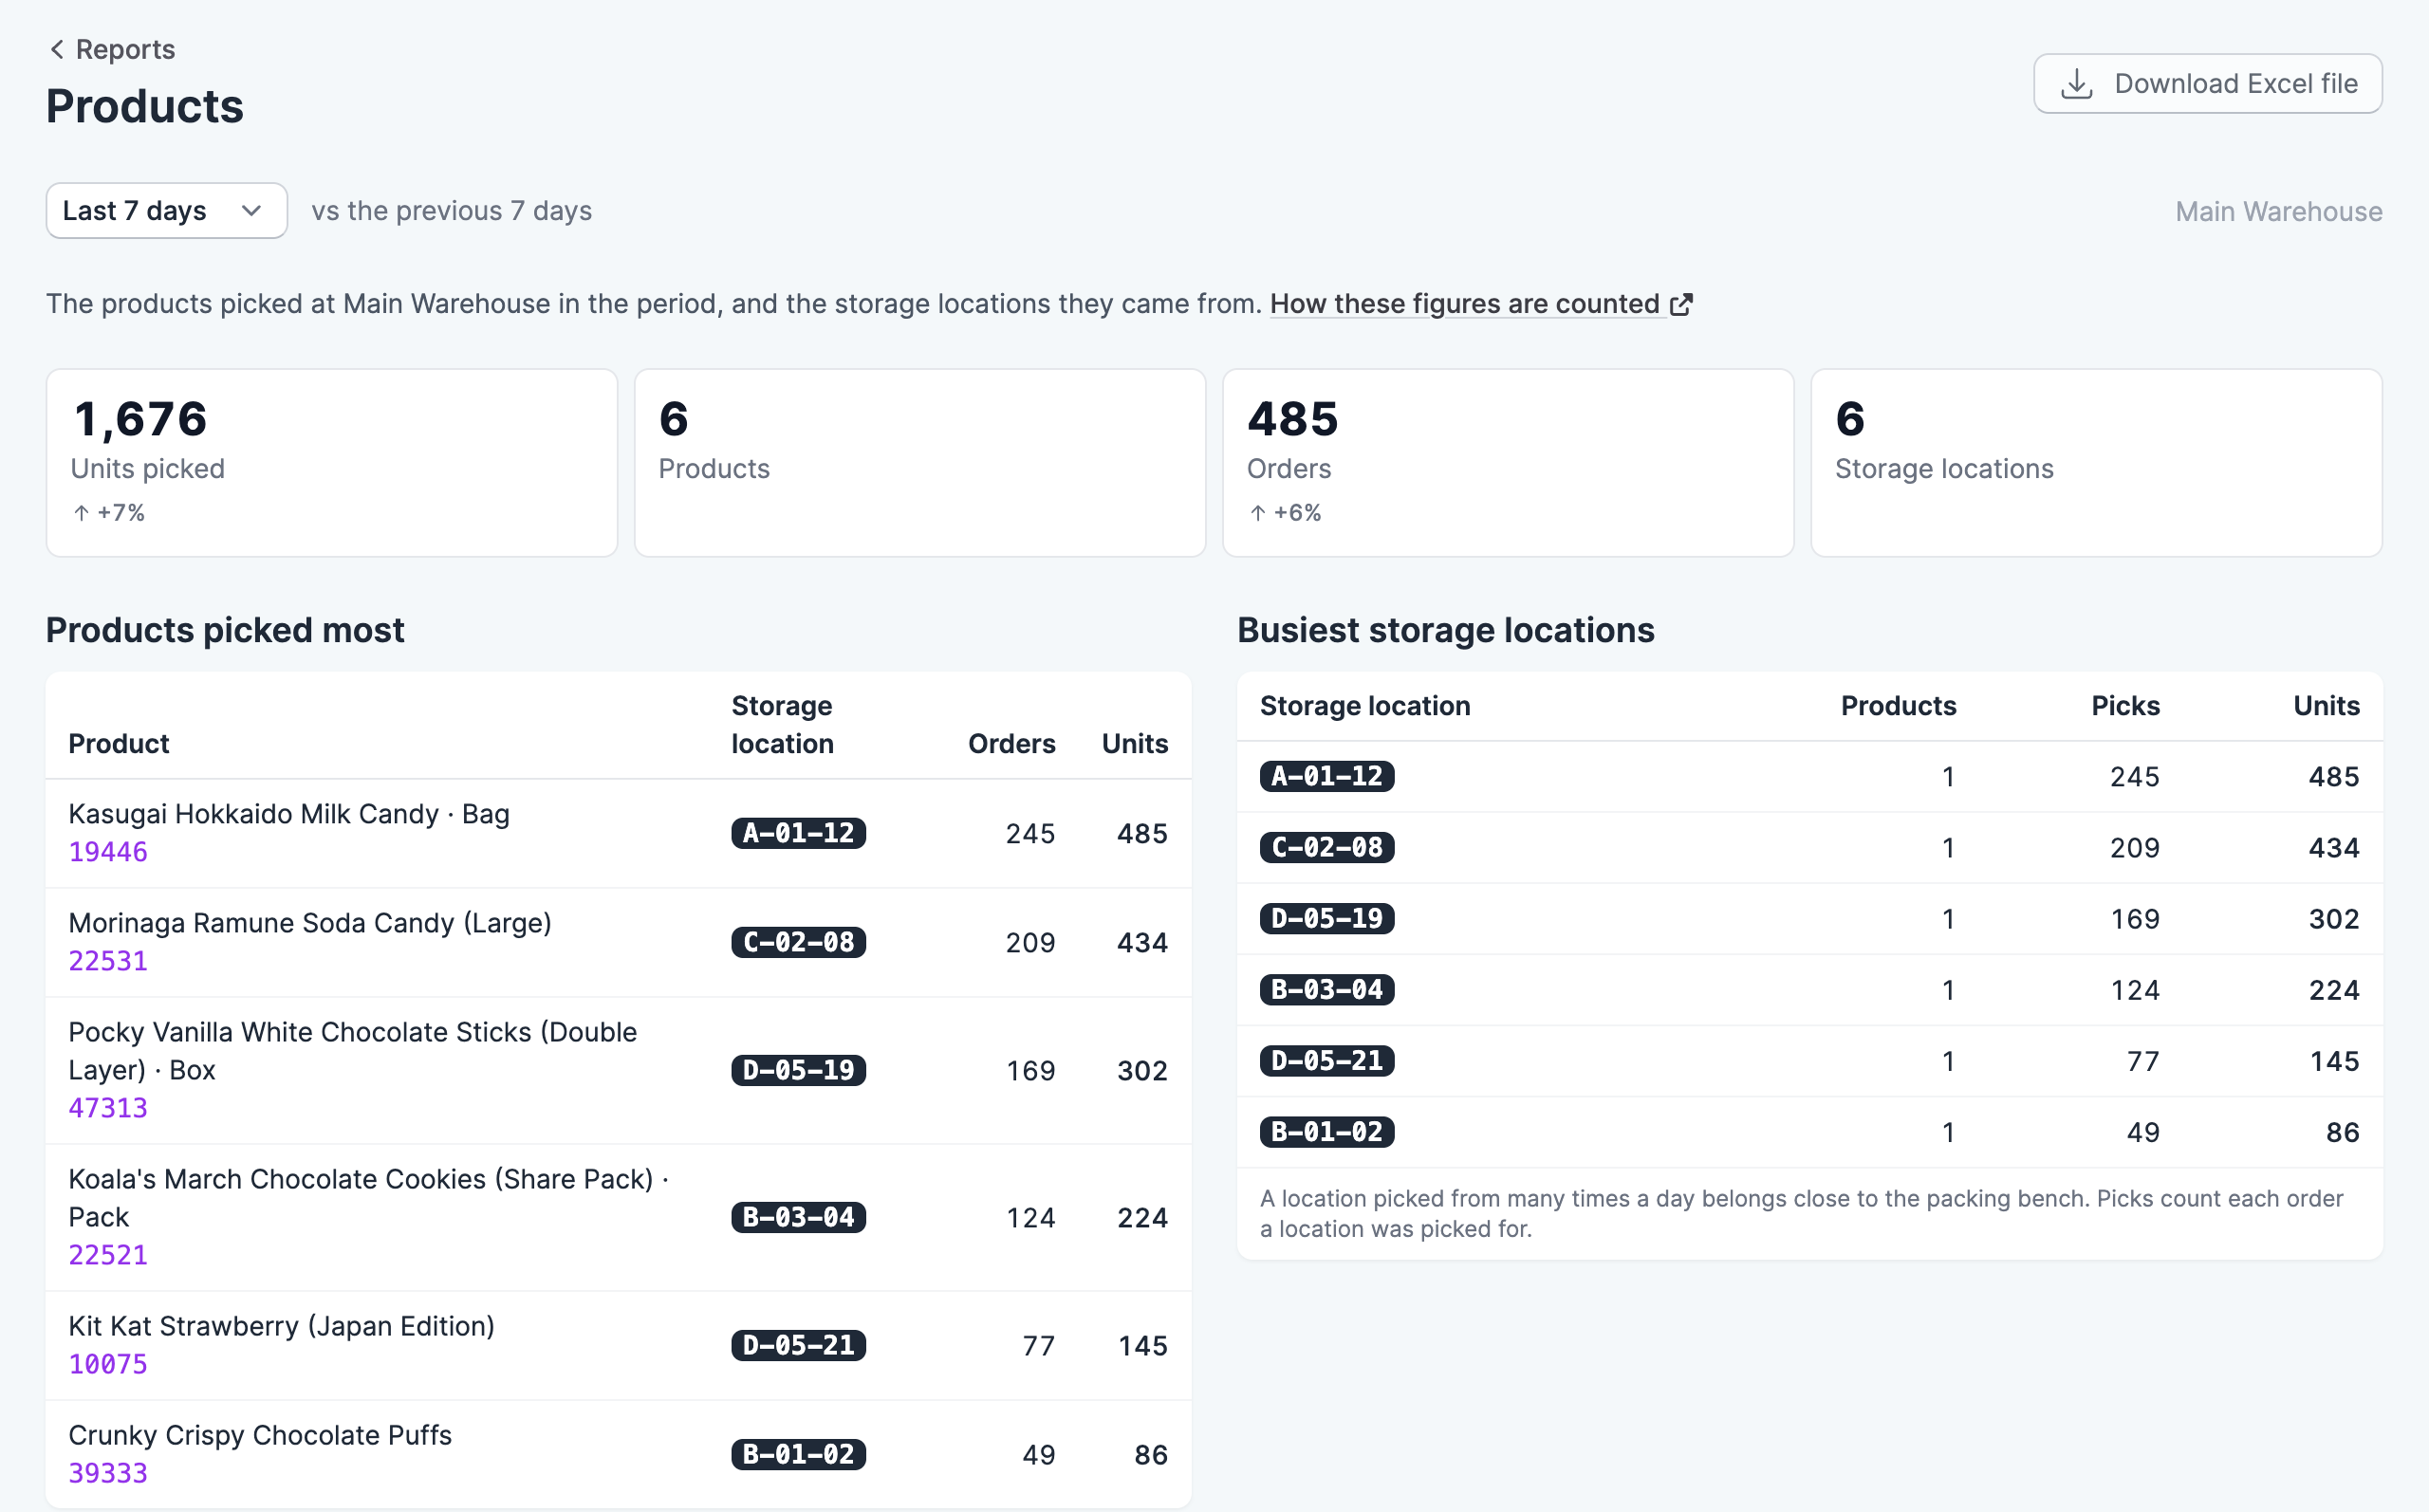
The products report shows which products were picked most in a period, and which storage locations were busiest.
Where to find it
Go to Reports, then click Products. You need the View reports permission to see it.
Choose a period from the menu at the top of the report: today, yesterday, or the last 7, 30 or 90 days. Most figures show how they changed against the period of the same length before it, and a change appears once there is an earlier figure to compare with. The report covers the location shown at the top right, which you can change from there.
Reading the report
Products picked most lists each product with its SKU, storage location, and the orders and units it was picked for.
Busiest storage locations lists each location with the products picked from it, the number of picks and the units. A pick counts each order a location was picked for. A location picked from many times a day belongs close to the packing bench, so this table is useful when you’re deciding where to store your fastest-moving products.
Download the report
Click Download Excel file to save the figures as a spreadsheet.