Reports
Scanpacker’s reports show how your warehouse is doing: how much is going out, how quickly, how accurately, who is doing the work, and what got in the way. They are built from what Scanpacker sees as your team starts, checks and fulfills orders, so there is nothing to set up. Open Reports in the sidebar to see them all.
Every report covers the location you are working at, and most let you choose today, yesterday, or the last 7, 30 or 90 days. Each figure is compared with the period of the same length just before it, so a number on its own becomes “better than last week” or “worse than last month”. Every report downloads as an Excel file.
The reports come with the paid plans and the 14-day free trial. On the Free plan, Reports shows the stock availability, short order and scan error reports.
You need the View reports permission to see the reports. Operators and packers do not have it, but they can still see their own figures in the Your day card on the dashboard. See roles and permissions.
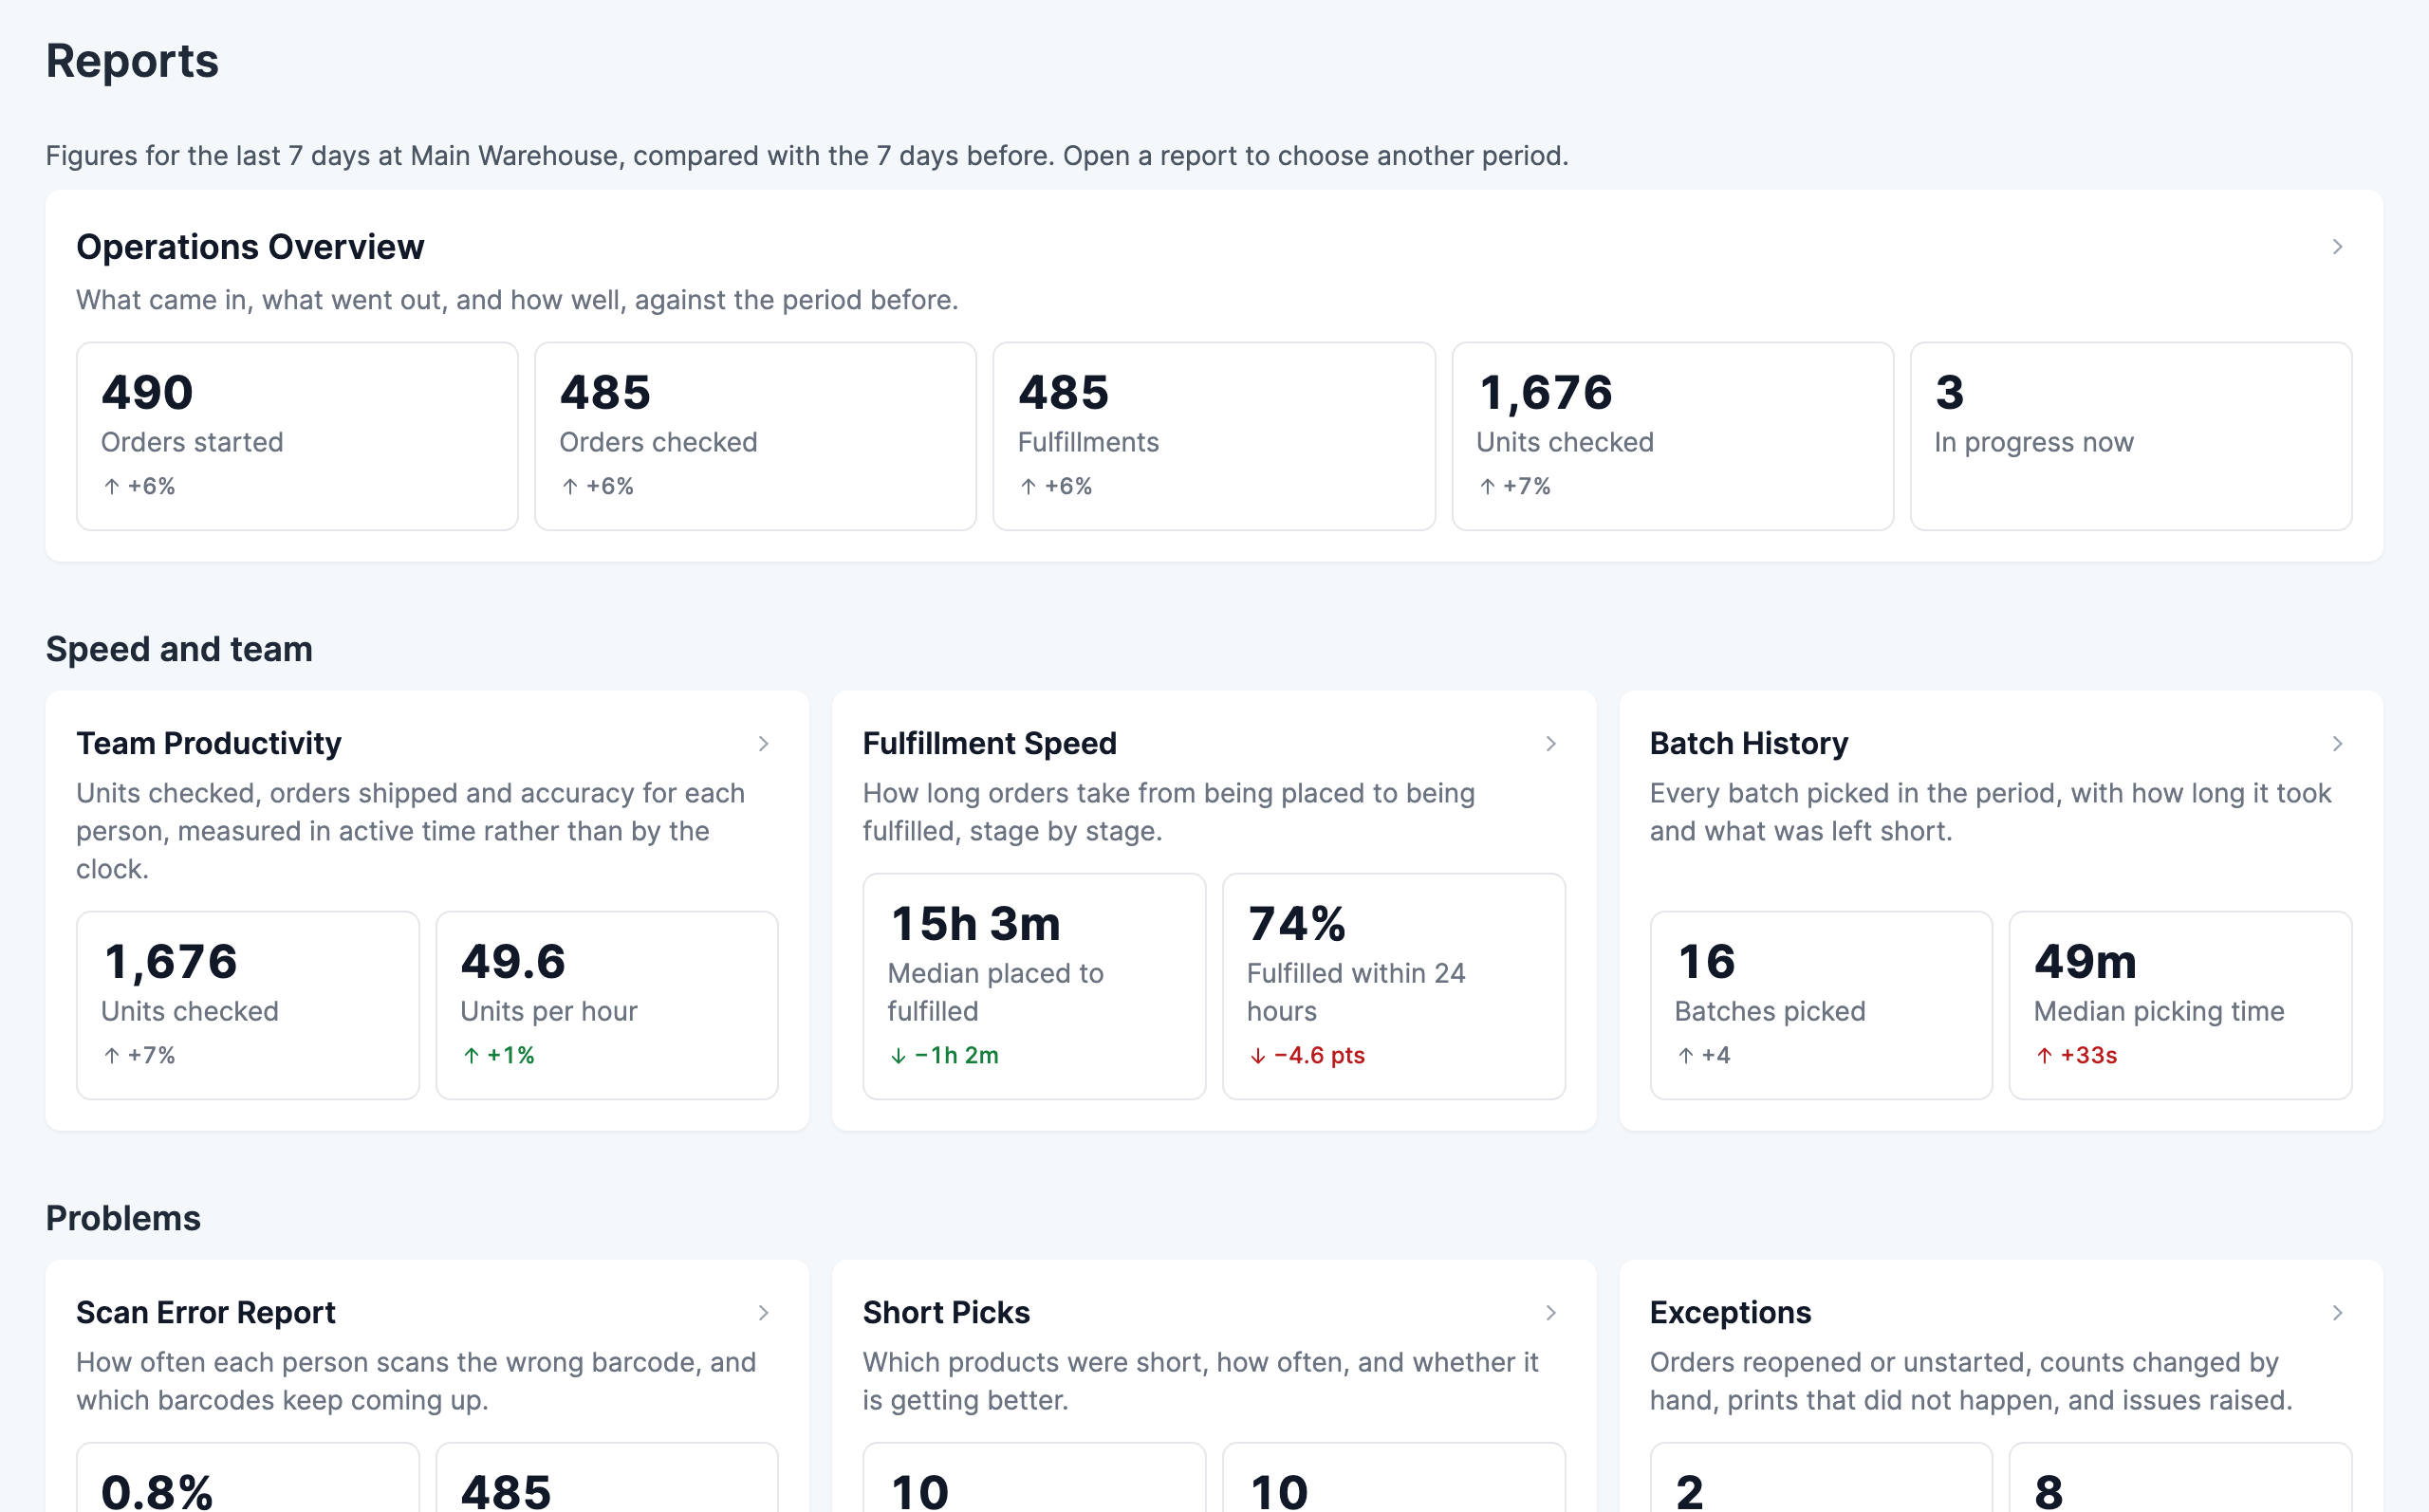
The reports
- Operations overview — the period at a glance: orders started, checked and fulfilled, speed, accuracy, shorts, issues and labels, with a trend of what came in against what went out. Start here.
- Team productivity — what each person checked and shipped, in units per active hour, with their accuracy and the exceptions they handled.
- Fulfillment speed — how long orders take from being placed to being fulfilled, stage by stage, and the share fulfilled within 24 hours.
- Scan error report — who scans the wrong barcode, how often, and which barcodes keep coming up.
- Exceptions — orders reopened or unstarted, counts changed by hand, prints that didn’t happen, and order issues.
- Short picks — the products that couldn’t be found, how often, and whether it is getting better.
- Products — what moved, how much, and which storage locations were busiest.
- Shipping and printing — labels bought by carrier and service, and documents printed, with failures.
- Receiving — stock received, accepted and rejected, and the products rejected most.
- Batch history — every batch picked, with how long it took and what was left short.
Two pages show the present rather than the past: order availability, which says what the queue needs and what is short right now, and the short order report, which lists the orders currently waiting on a missing item.
For the floor and the inbox
- The live board puts today’s figures on a screen in the warehouse, refreshed every minute.
- Everyone sees their own Your day card on the dashboard, with their units, speed and accuracy for today against their own last seven days.
- The weekly digest and alerts send last week’s figures to your inbox every Monday, and an email when the scan error rate or the queue crosses a threshold you set.
- The reports API gives your own spreadsheets and BI tools the same data as CSV or JSON.
How the figures are counted
Scanpacker keeps a record of each order’s journey through the warehouse: when it was started, checked and fulfilled, by whom, in which batch, what was picked and what was short. The records are kept after the order ships, so the reports have history even though the order itself has moved on.
A few terms appear throughout:
- Units are items counted by quantity. An order for two of one product and one of another is three units.
- Checked means an order finished checking, as described in checking orders.
- Active time is the time between the actions Scanpacker saw, leaving out any gap of more than 10 minutes, so breaks and interruptions don’t count as time spent.
- Median is the middle value: half of the orders were faster, half slower. Reports use medians rather than averages so one order that waited a week doesn’t hide what happened to the rest.
Each report page explains its own figures in more detail.
Related documentation
- Roles and permissions — who can see the reports
- Checking orders — the step most of the figures are built on