Scan error report
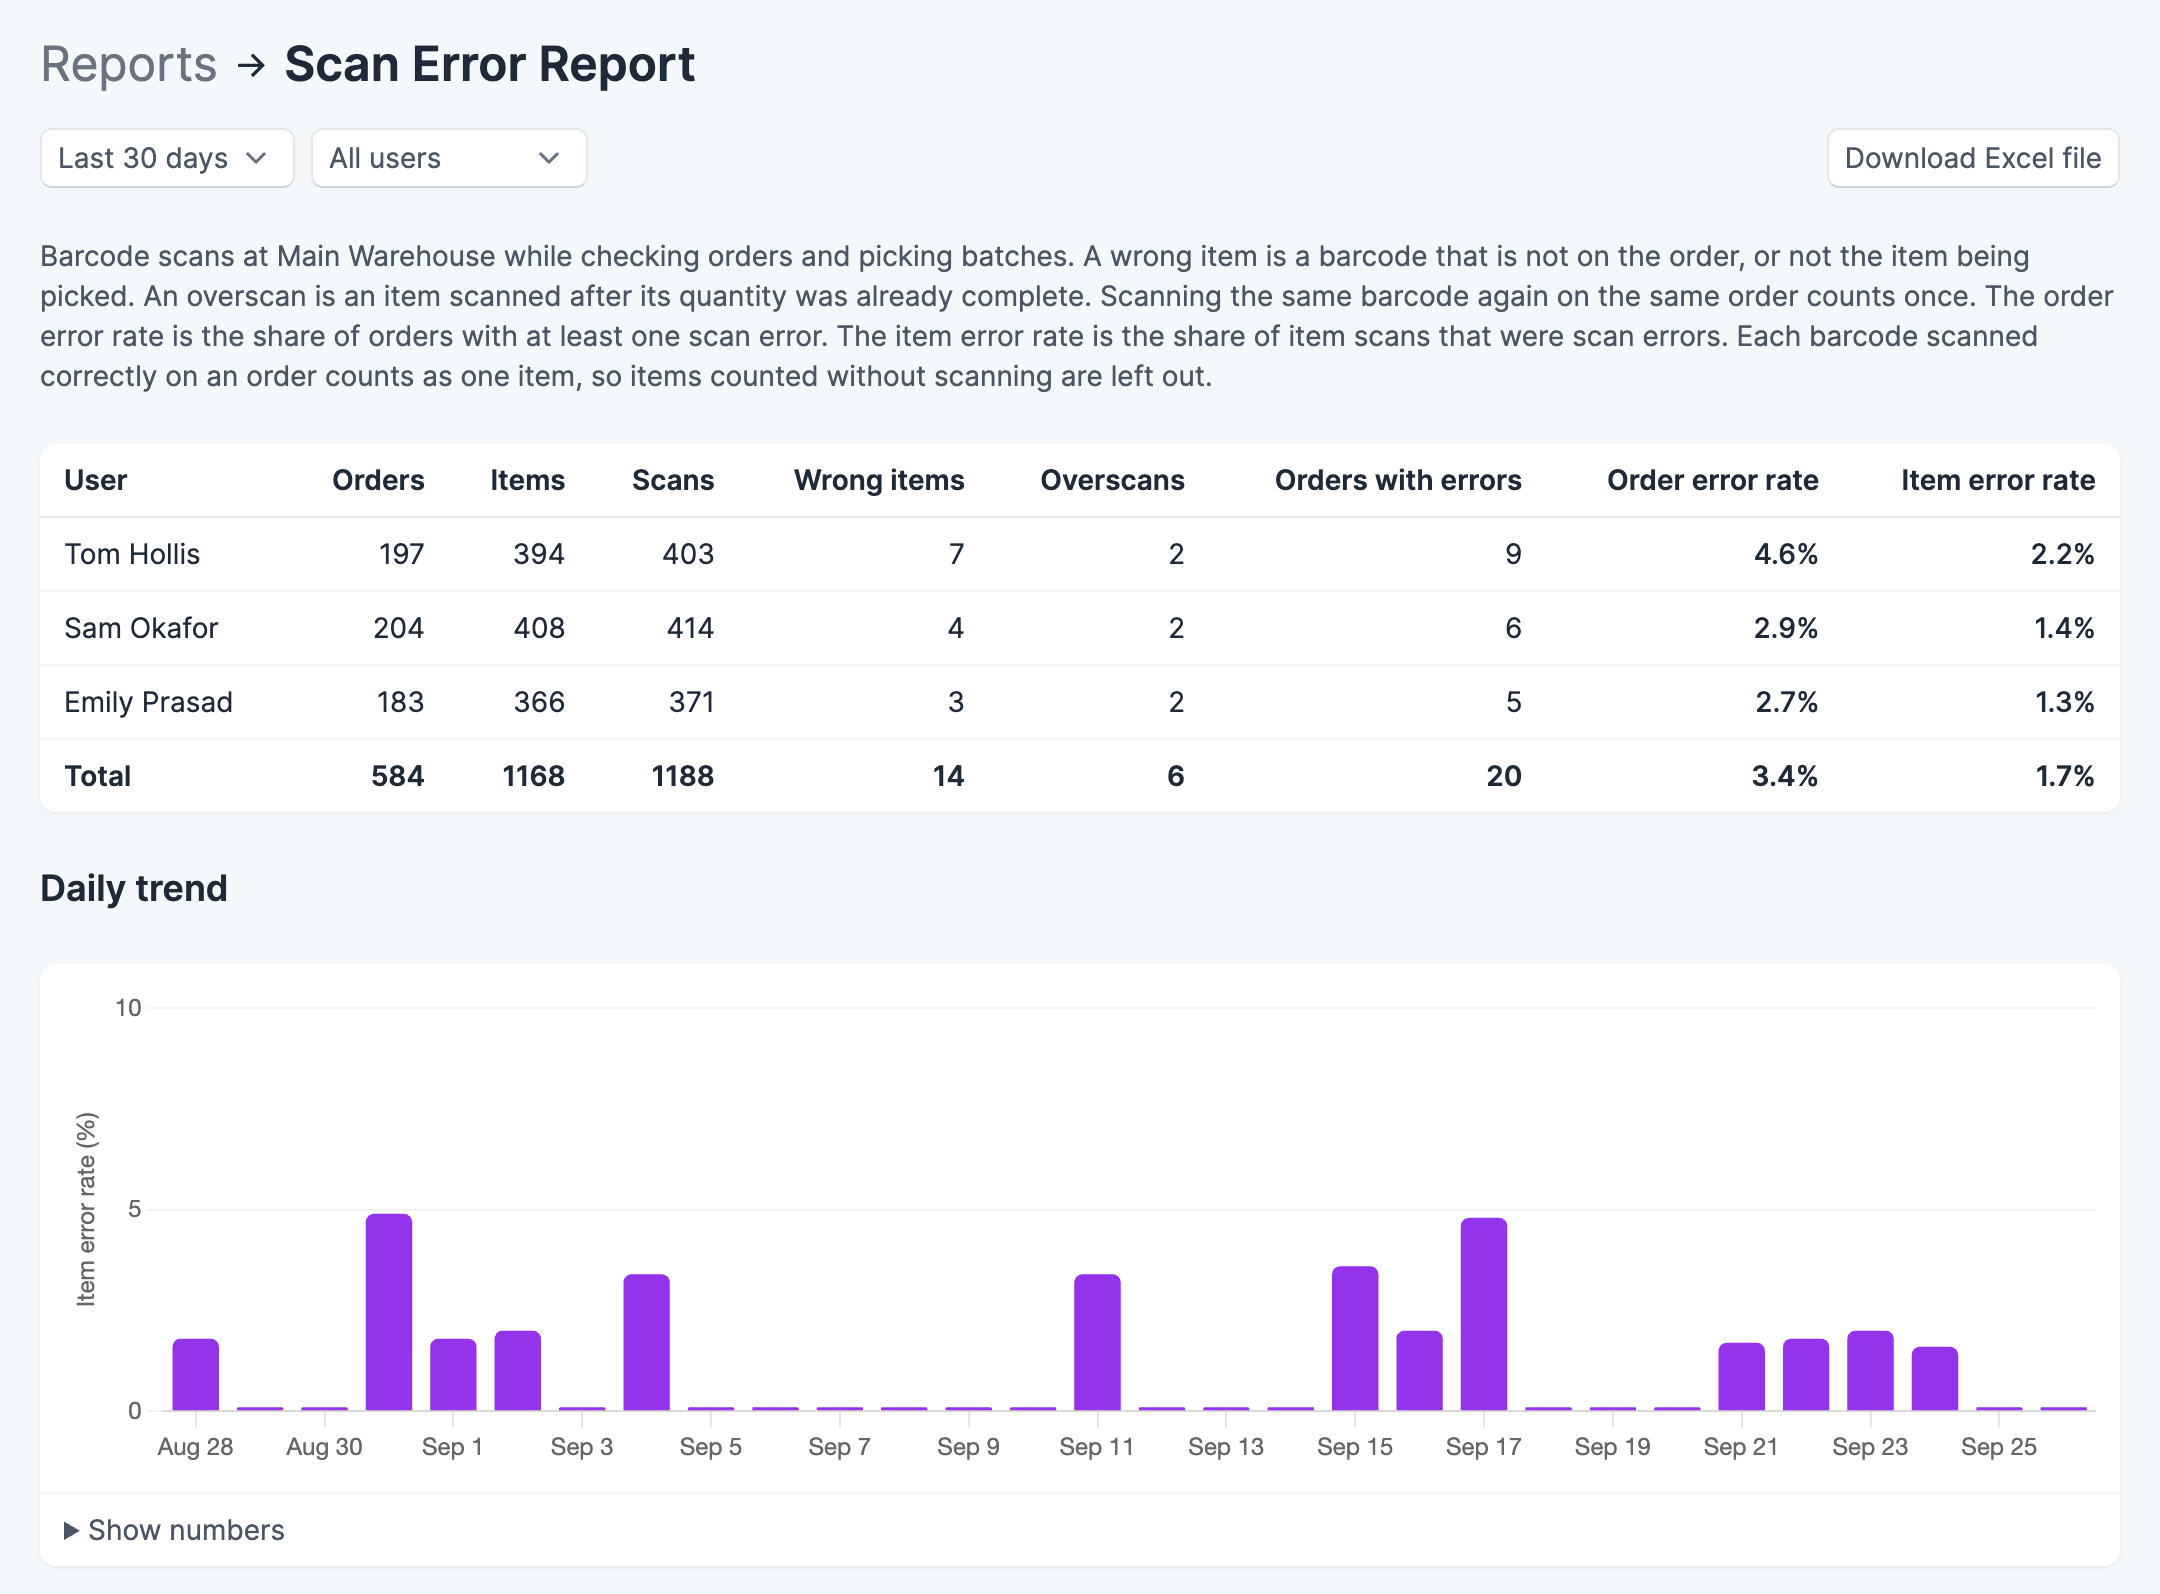
The scan error report shows how often each team member scans the wrong barcode while checking orders or picking batches. Use it to track error rates over time and to find out which products or people need attention.
Where to find it
Go to Reports, then click Scan Error Report. You need the View activity permission to see it. See roles and permissions.
The report covers the location you are working at. To see another location, switch location first.
What counts as a scan error
Scanpacker records every barcode your team scans while checking an order or picking a batch. A scan is an error when it is one of these:
- Wrong item — the barcode is not on the order. In batch picking, it is not the item you are picking.
- Overscan — the item is on the order, but you already scanned all of it.
If someone scans the same wrong barcode several times on one order, it counts as one wrong item. The same goes for scanning a finished item again. This way, retrying a scan does not push up the numbers. Scanning two different wrong barcodes on one order counts as two wrong items.
Scans made by clicking a barcode on the screen are not counted.
Reading the summary
The table at the top has one row per user:
- Orders — orders the user scanned items for.
- Items — items the user scanned correctly. Each different barcode scanned correctly on an order counts as one item.
- Scans — barcodes the user scanned, including repeats.
- Wrong items and Overscans — scan errors of each kind.
- Orders with errors — orders with at least one scan error.
- Order error rate — orders with errors as a percentage of orders. For example, 4% means one order in 25 had a scan mistake.
- Item error rate — scan errors as a percentage of all item scans, both correct and wrong. For example, 2% means one item scan in 50 was a mistake.
The order error rate goes up with order size, because an order with many items has more chances for a mistake. The item error rate does not, so it is the better one for comparing people who check different kinds of orders.
Items that are counted without scanning, for example by clicking + or typing a quantity, are not included in Items. If your team does this a lot, the item error rate will be higher than the true rate.
Users with the highest order error rate are listed first. Choose a period (today, or the last 7, 30 or 90 days) and a user to narrow the report.
Trend chart
The report shows a bar chart of the item error rate over the period:
- For the last 7 or 30 days, there is one bar per day.
- For the last 90 days, there is one bar per week. Weeks start on Monday, and the first and last weeks can be partial.
- For today, there is no chart.
Every day or week has a bar. A day with no errors, or no scans at all, shows a thin bar at 0%.
Click Show numbers below the chart to see each day or week with scans, with the same columns as the summary. Use it to check whether a high bar comes from a quiet day.
To see how one person is doing over time, choose that user.
The scan error list
Below the summary, each scan error is listed with the time, the user, the kind of error, the barcode scanned, the order, and the batch number if there was one. Click an order to open it.
A barcode that keeps showing up as a wrong item can mean a product has the wrong barcode in Shopify, or two products look alike on the shelf.
Download the report
Click Download Excel file to save the report as a spreadsheet. It has three sheets: the summary, the trend (by day or by week, as in the chart), and every scan error in the period.