Team productivity
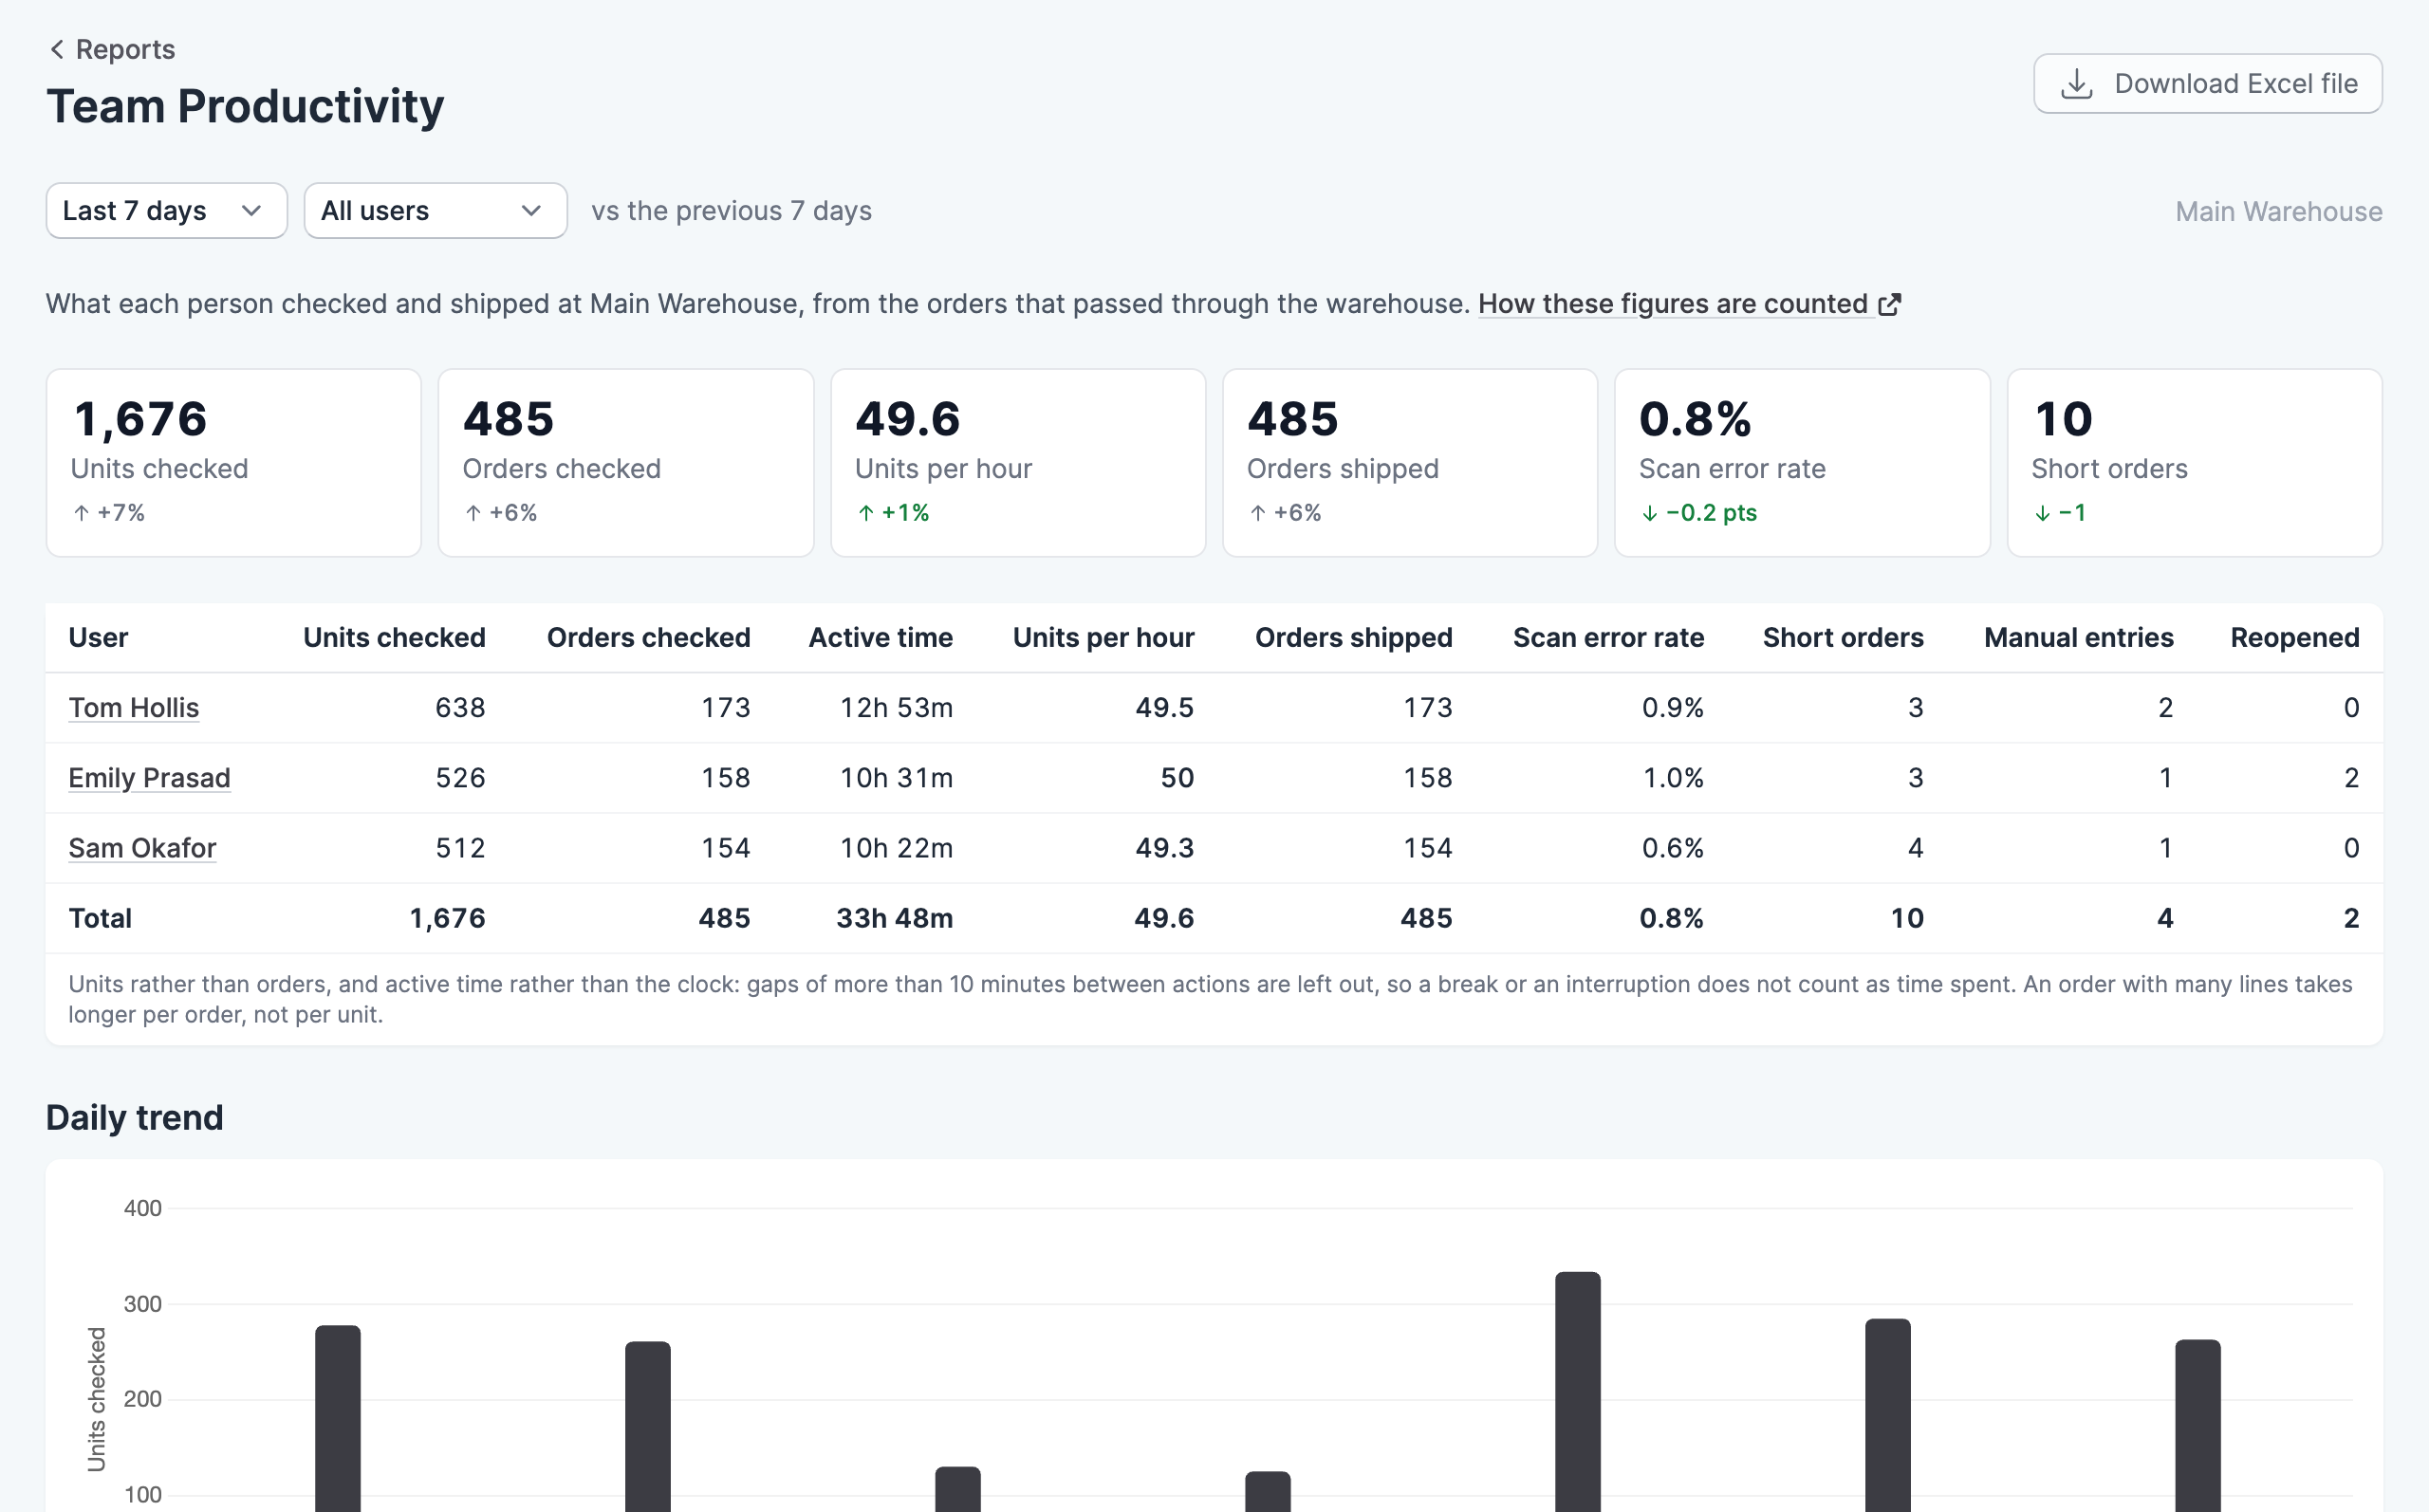
The team productivity report shows what each person checked and shipped, so you can see how work is shared across the team and where someone might need support.
Where to find it
Go to Reports, then click Team Productivity. You need the View reports permission to see it.
Choose a period from the menu at the top of the report: today, yesterday, or the last 7, 30 or 90 days. Most figures show how they changed against the period of the same length before it, and a change appears once there is an earlier figure to compare with. The report covers the location shown at the top right, which you can change from there. To see one person’s figures, choose them from the user menu or click their name in the table.
How the figures are counted
The report compares people by units per hour rather than orders per hour, and it measures active time rather than time on the clock. Gaps of more than 10 minutes between actions are left out of active time, so a break or an interruption doesn’t count against anyone. Someone checking orders with many lines takes longer per order, but not per unit, which is why units give a fairer comparison.
Each row also shows the orders the person shipped, their scan error rate, how many of their orders finished short, how many quantities they entered by hand, and how many of their orders were reopened. A high figure in one of these columns is a reason to ask what happened, because it may come from the products or orders that person handled.
Who can see team figures
The report is for people with the View reports permission. To decide whether everyone can see each person’s figures on the live board, use Show team figures to everyone in the Reports section of your scanning settings. When it’s off, the board shows totals only and each person sees just their own figures on the dashboard.
Download the report
Click Download Excel file to save the figures as a spreadsheet.