Short picks
The short picks report shows which orders finished short in a period and which products were short in them, so you can see whether a stock problem keeps coming back.
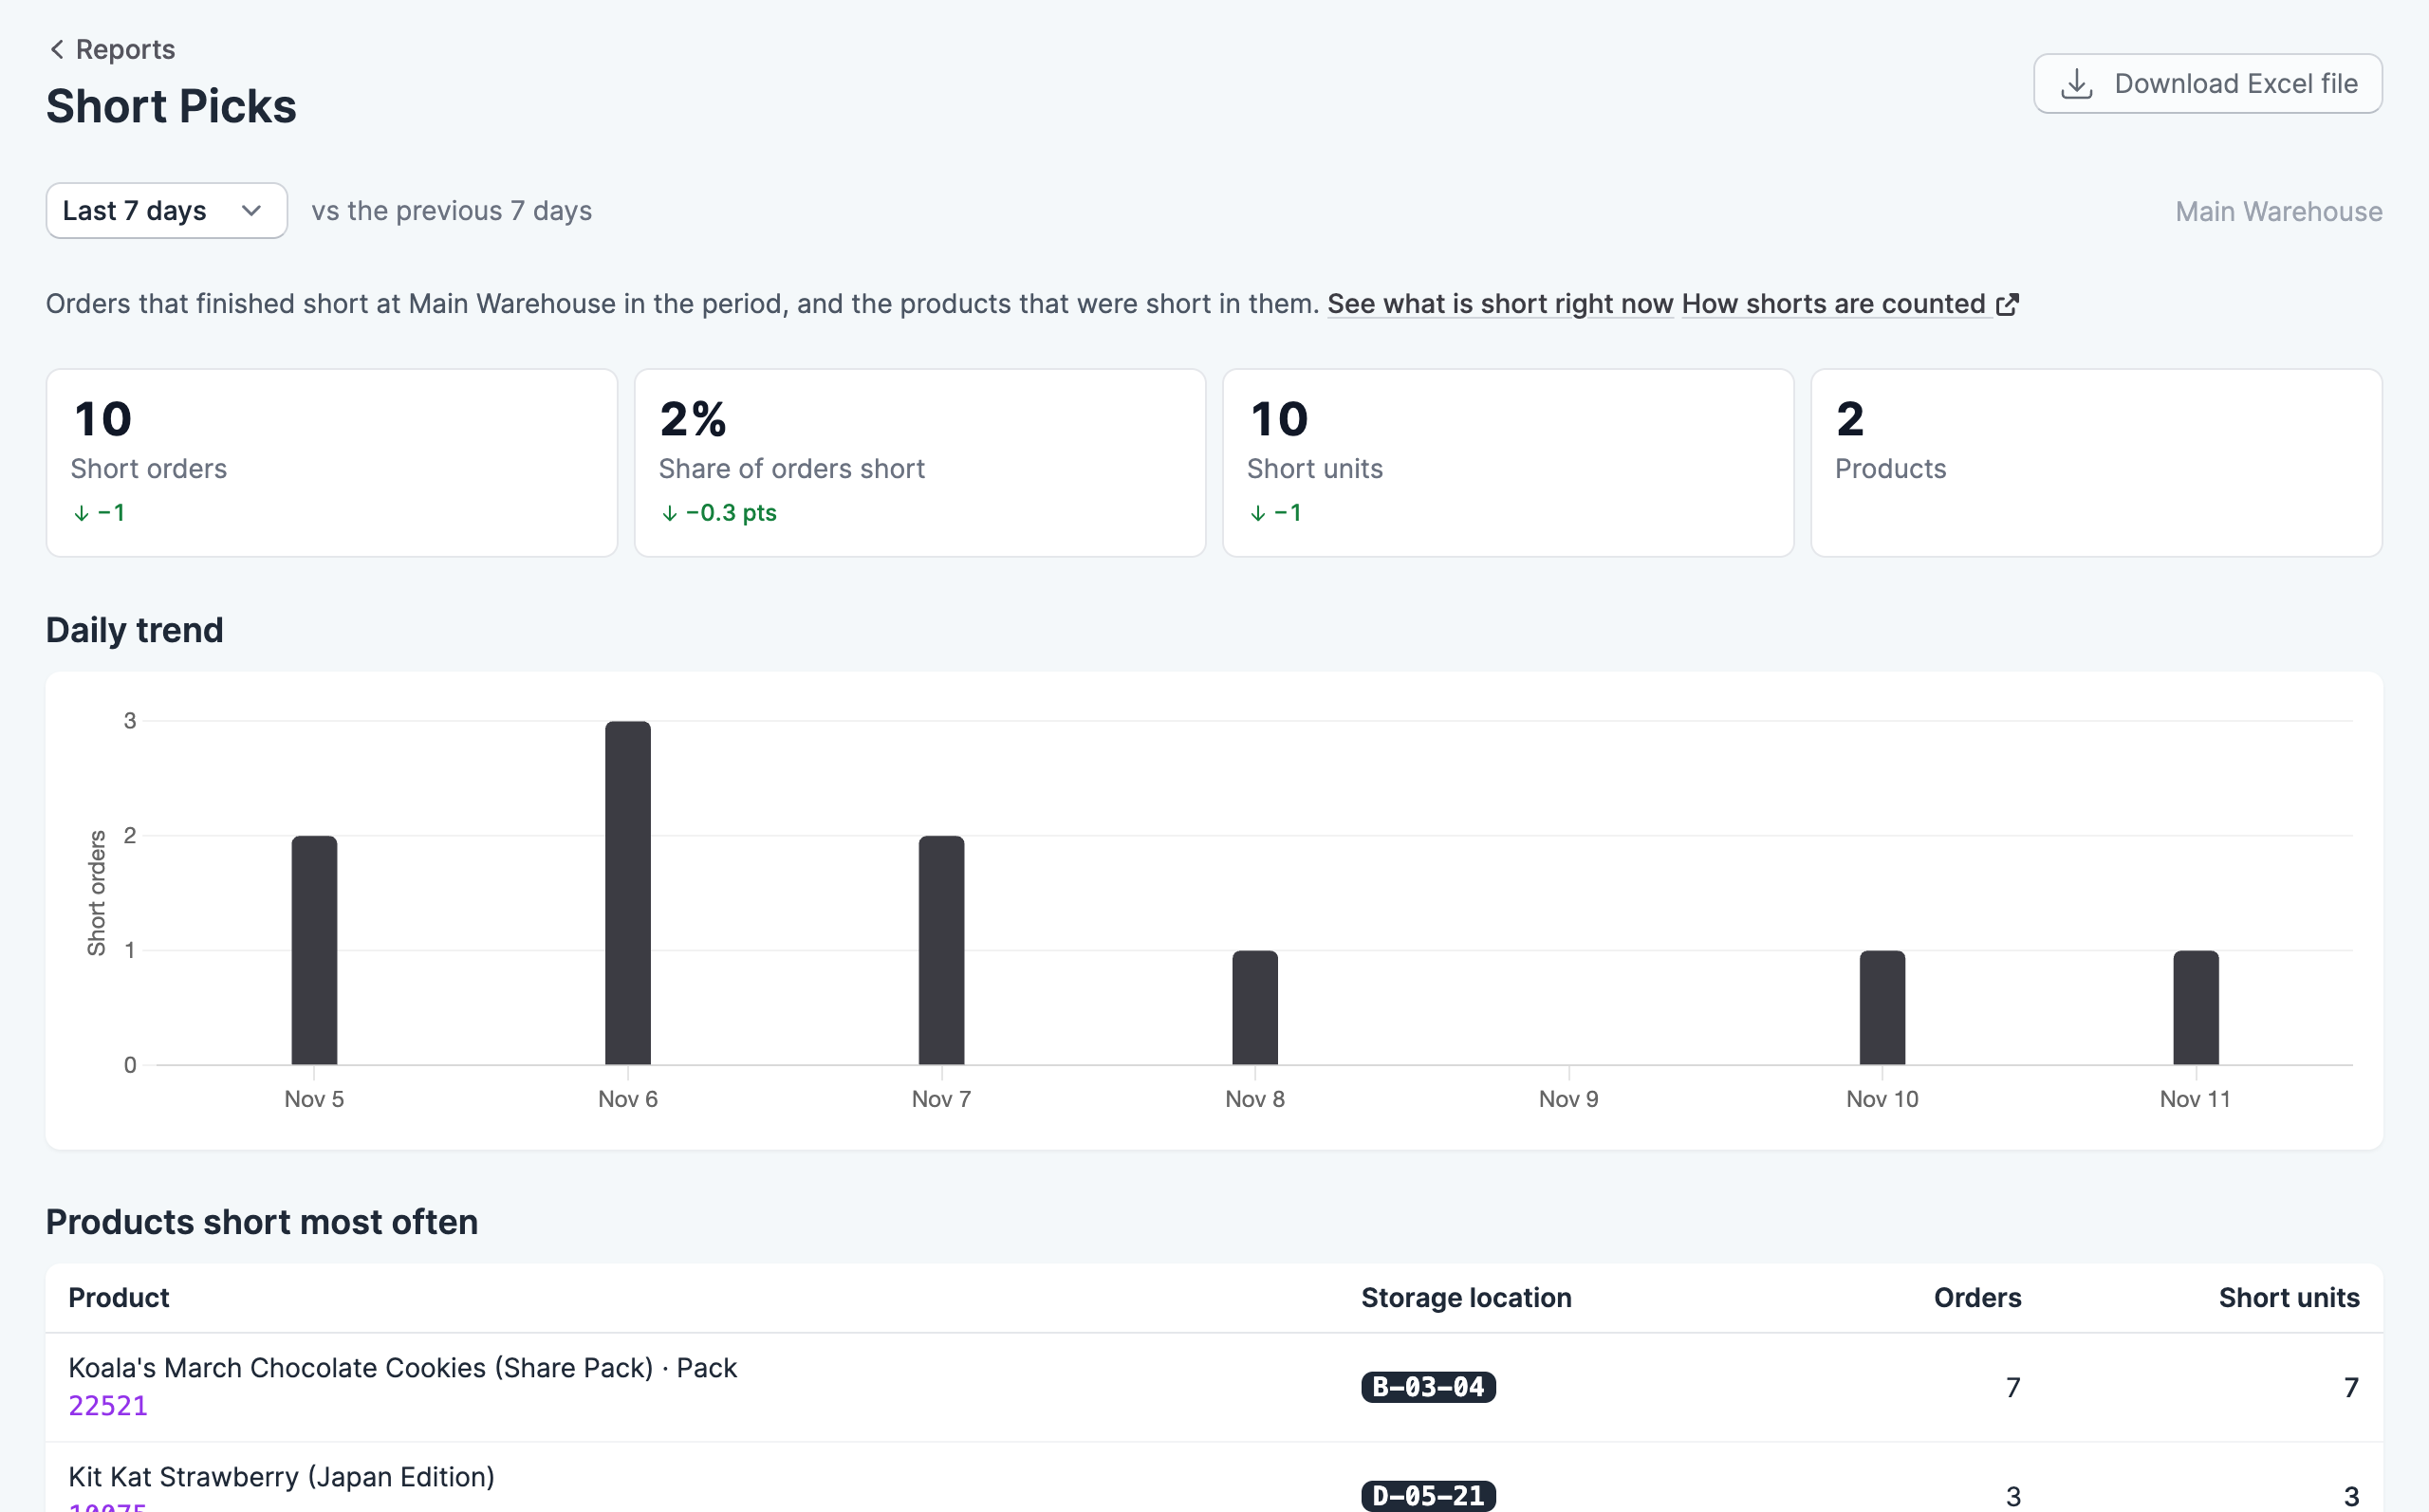
Where to find it
Go to Reports, then click Short Picks. You need the View reports permission to see it.
Choose a period from the menu at the top of the report: today, yesterday, or the last 7, 30 or 90 days. Most figures show how they changed against the period of the same length before it, and a change appears once there is an earlier figure to compare with. The report covers the location shown at the top right, which you can change from there.
How it differs from the Short Order Report
An order is counted here when it ships or leaves the queue, from the items that were still short at that moment. The Short Order Report answers a different question: it lists what’s short right now, so your team knows what to set aside or reorder today. Use this report to look for patterns over time.
Reading the report
The figures show how many orders finished short, what share of all orders that is, how many units were short, and how many different products were involved. The table lists the products, with the ones short most often first, along with their storage locations. If a product keeps appearing here, check its stock count and whether the storage location is right.
Download the report
Click Download Excel file to save the figures as a spreadsheet.