Operations overview
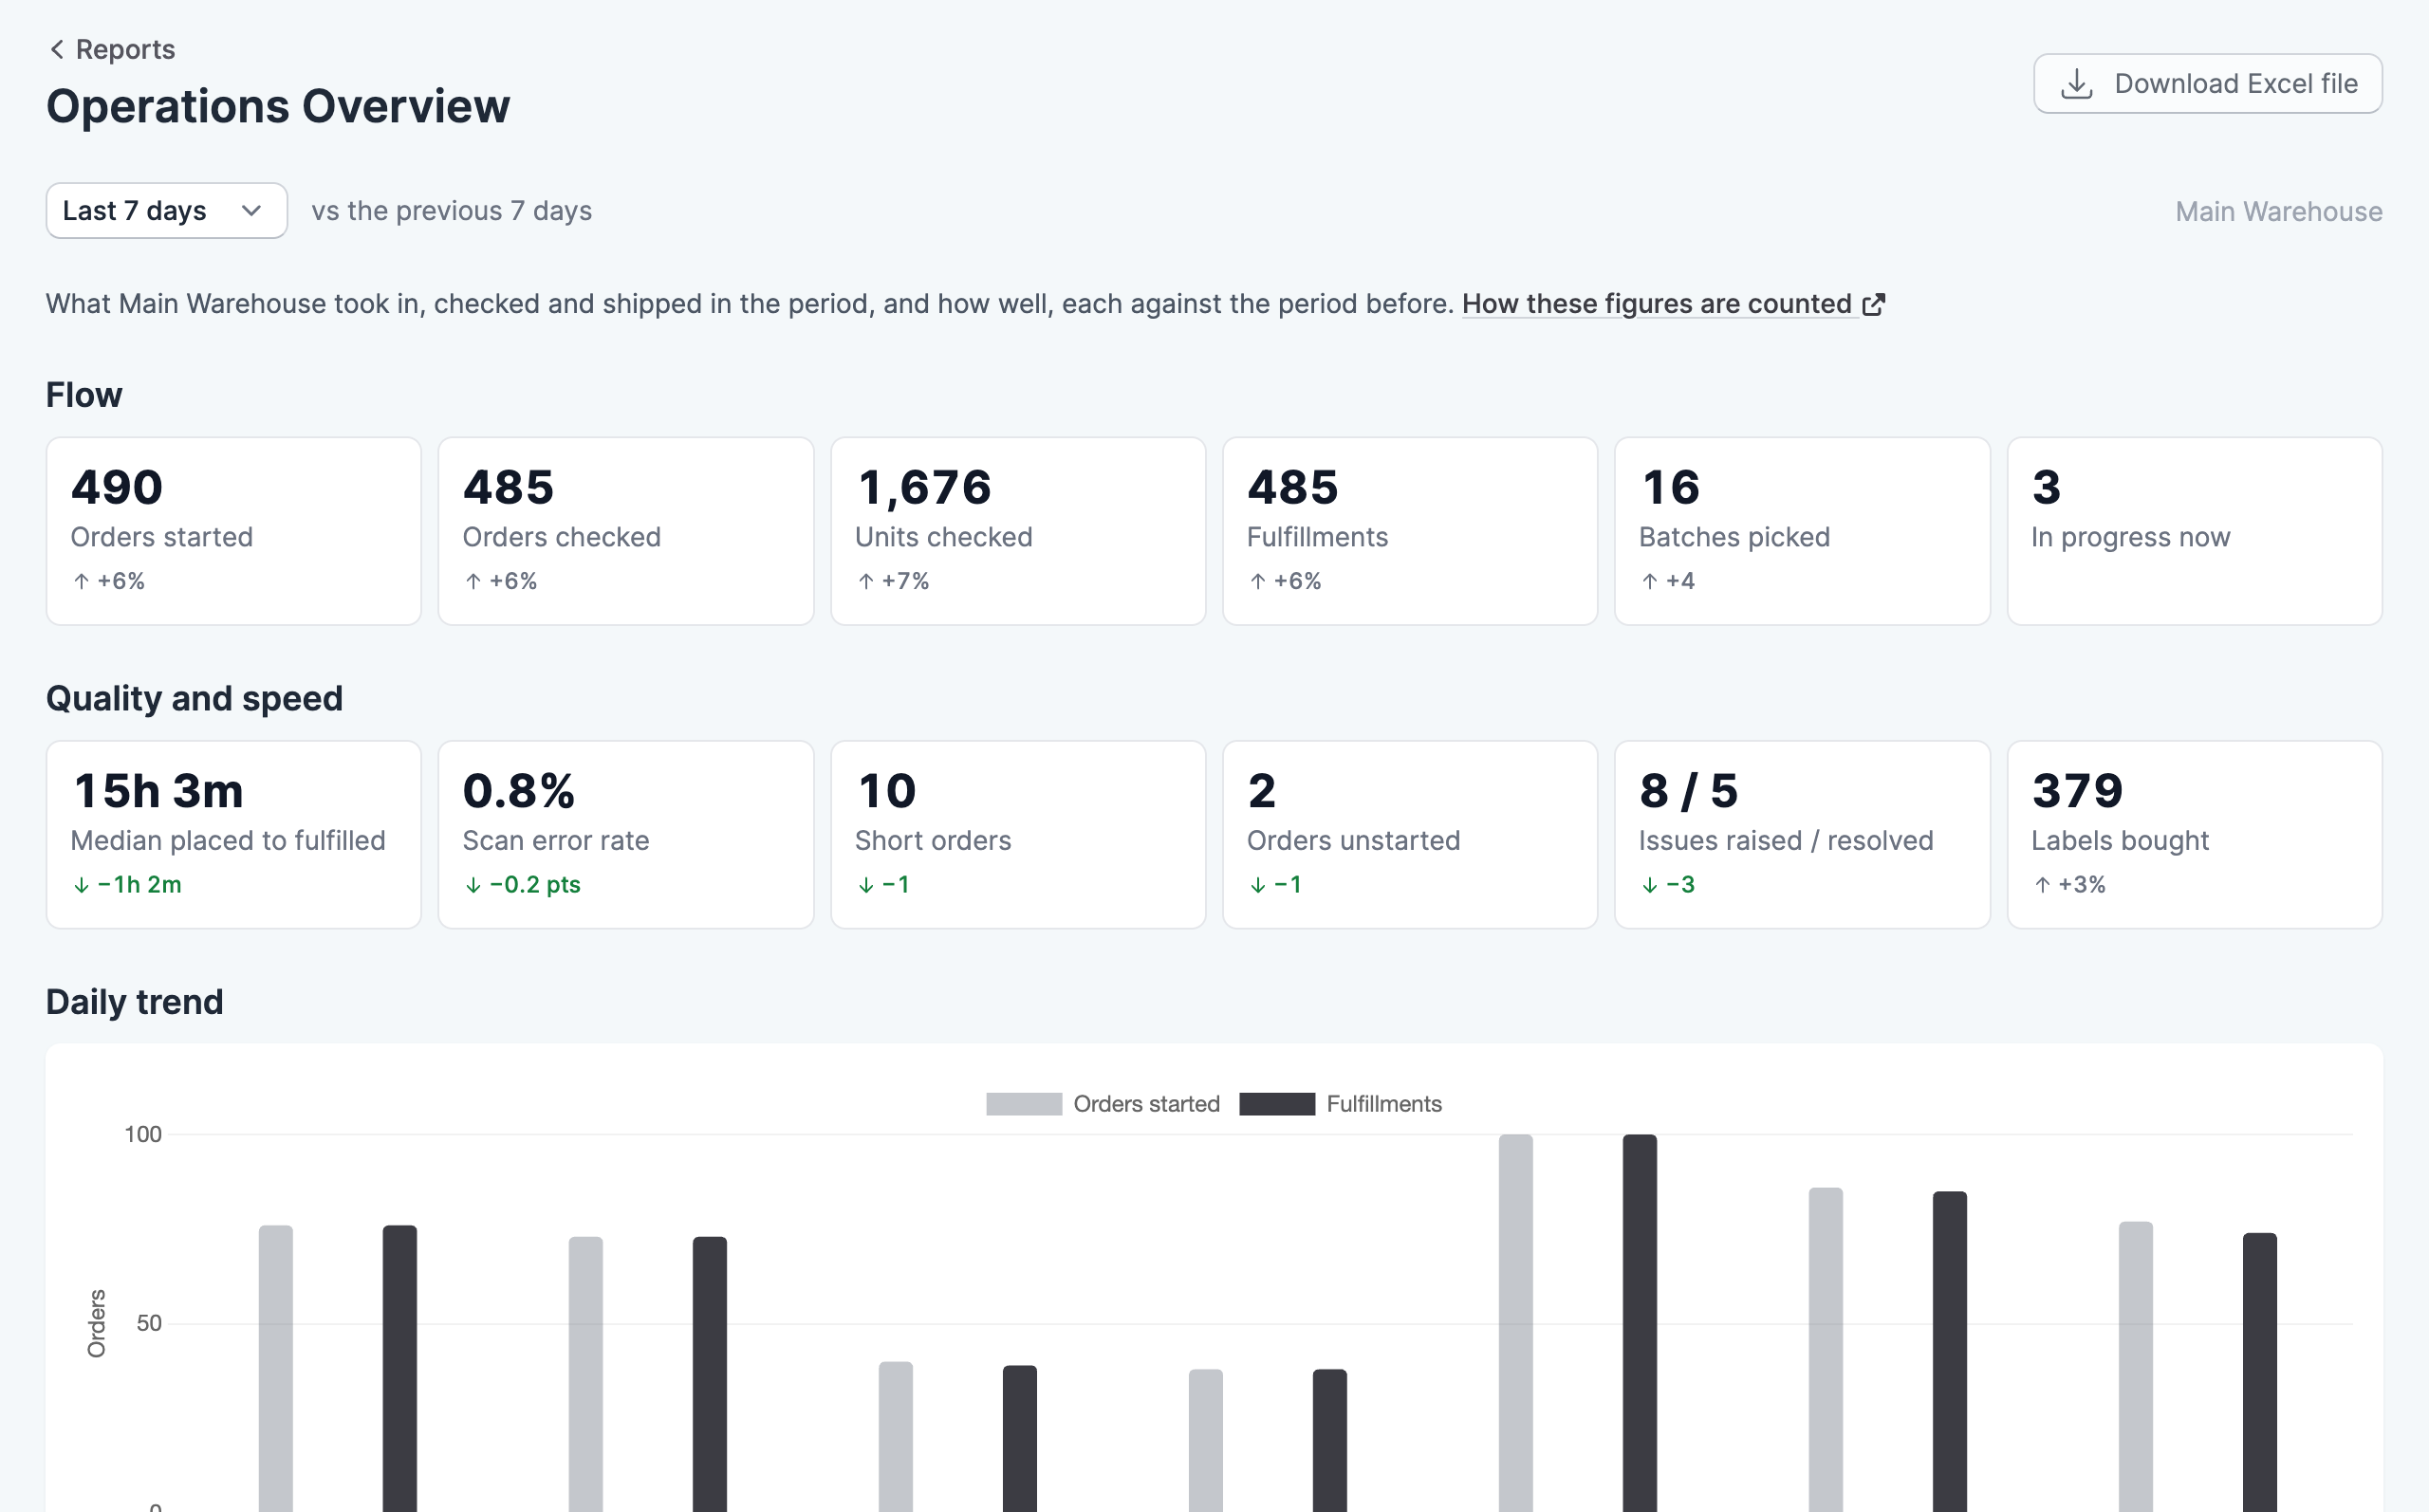
The operations overview shows what your warehouse took in, checked and shipped over a period, and how well it went. It’s the best place to start, because each figure leads to the report that explains it.
Where to find it
Go to Reports, then click Operations Overview. You need the View reports permission to see it.
Choose a period from the menu at the top of the report: today, yesterday, or the last 7, 30 or 90 days. Most figures show how they changed against the period of the same length before it, and a change appears once there is an earlier figure to compare with. The report covers the location shown at the top right, which you can change from there.
Reading the figures
The Flow figures show the work moving through the warehouse: orders started, orders checked, units checked, fulfillments and batches picked, along with the orders in progress right now. If orders started stays above fulfillments for several days, the team is falling behind what’s coming in.
The Quality and speed figures show how that work went: the median time from an order being placed to being fulfilled, the scan error rate, short orders, orders sent back to the queue, order issues raised and resolved, and shipping labels bought. Click a figure to open the report behind it.
The daily trend chart compares orders started with fulfillments. Periods longer than a month show one bar per week. Click Show numbers below the chart to see the figures for each day or week.
Download the report
Click Download Excel file to save the figures as a spreadsheet.